Monitoring & Metrics
This page covers all the metrics exposed in the Responsive Dashboard as well as how to integrate with our Metrics API (which exposes more metrics than are available in the Dashboard by default).
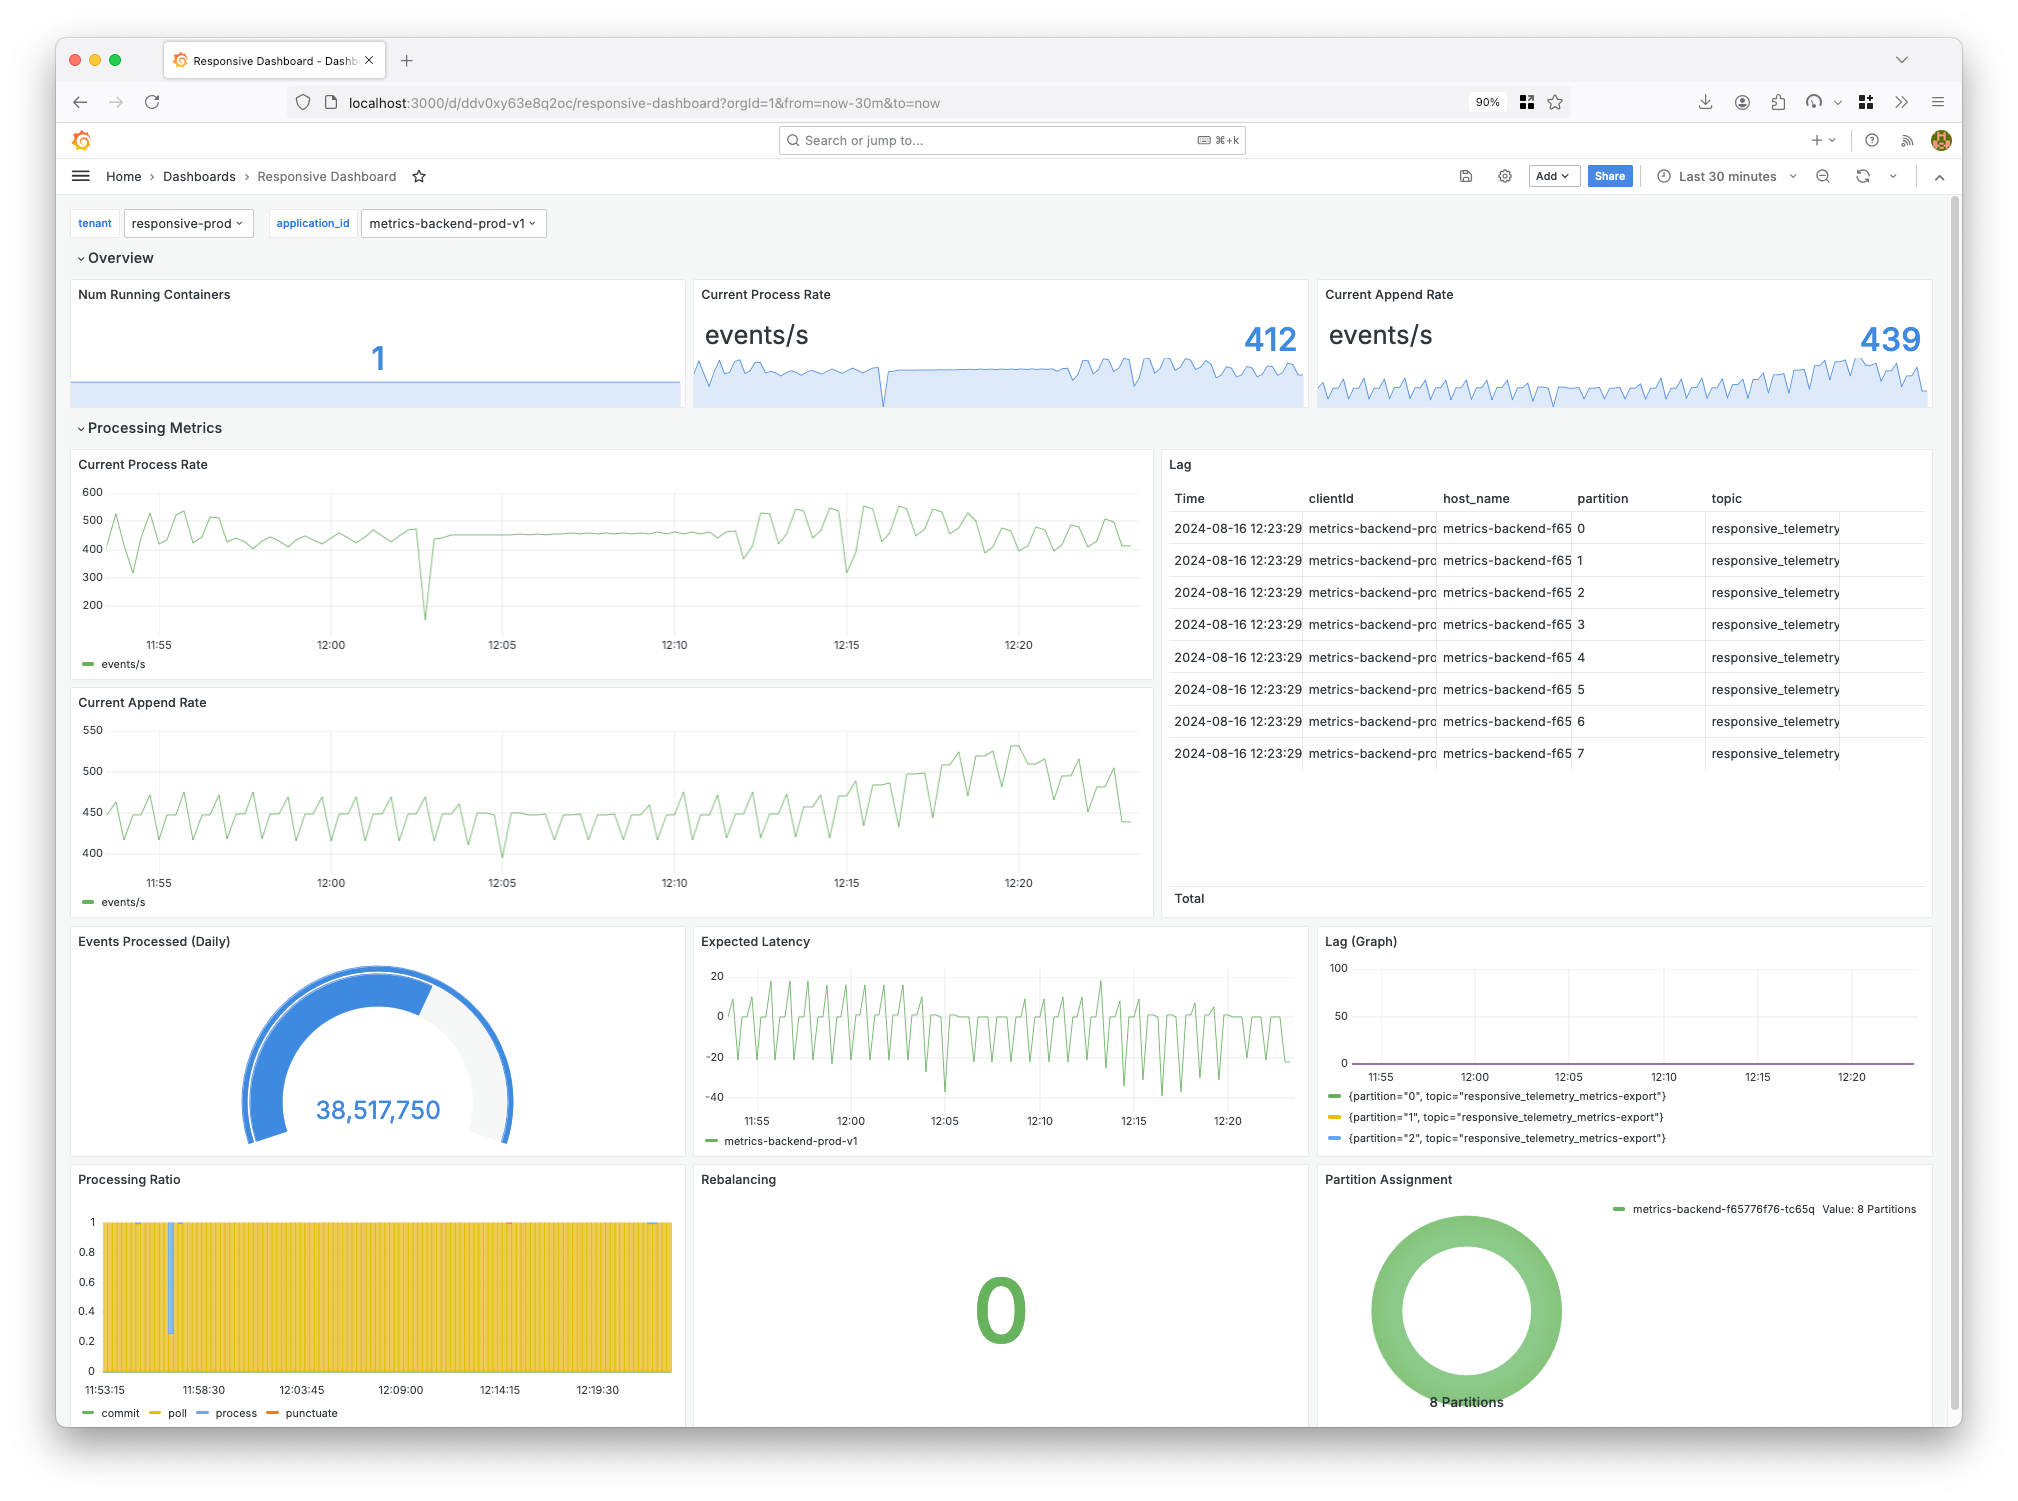
The Responsive Dashboard
The dashboard in our UI is broken up into three sections:
- An Overview that provides at-a-glance information on the health of your application.
- A Processing Metrics section that dives deeper into the state of processing.
- A Storage Metrics section (only available with Responsive configured storage) that snapshots some information on associated state storage.
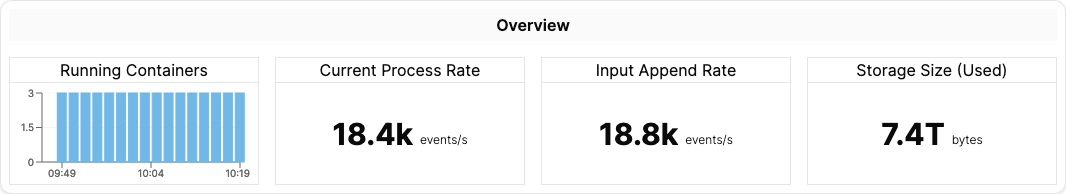
Overview Metrics
| Title | Metric (Exposed via Metrics API) | Description |
|---|---|---|
| Running Containers | This is a derived metric which counts the number of containers emitting kafka_streams_thread_process_rate | The number of running Kafka Streams containers |
| Current Processing Rate | kafka_streams_thread_process_rate | This is the number of events per second processed across your entire application |
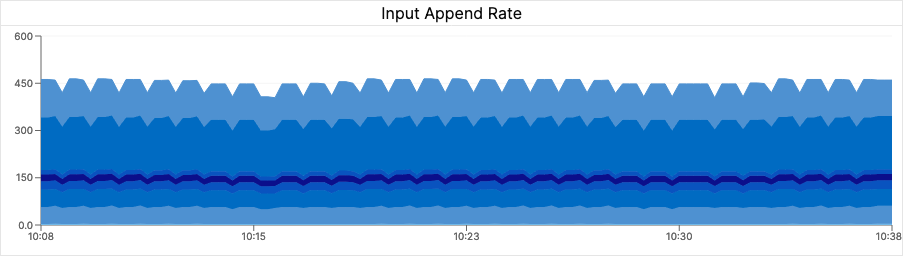
| Input Append Rate | diagnoser_latency_expected_partition_append_rate | This is the number of events per second that are being appended across all input topic(s) processed by your application |
| Storage Size (Used) | hardware_disk_metrics_disk_space_used_bytes for MongoDB and node_filesystem_size_bytes for ScyllaDB | The amount of storage utilized by your state store in the remote database. |
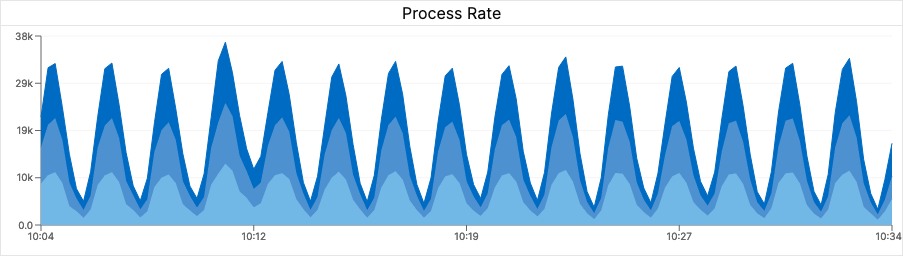
Processing Metrics
| Title | Metric (Exposed via Metrics API) | Description |
|---|---|---|
| Process Rate (Graph) | kafka_streams_thread_process_rate | This is the number of events per second processed (per container) |
| Input Append Rate (Graph) | diagnoser_latency_expected_partition_append_rate | This is the number of events per second that are being appended across per input topic-partition processed by your application |
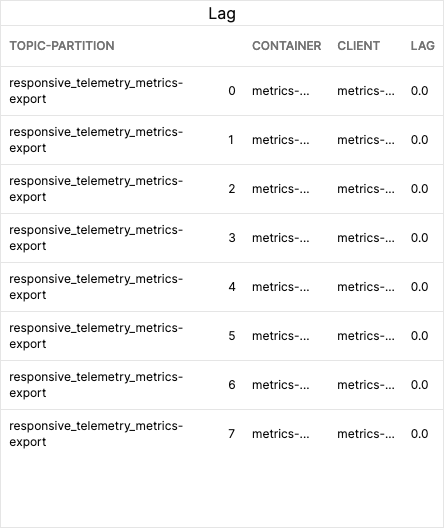
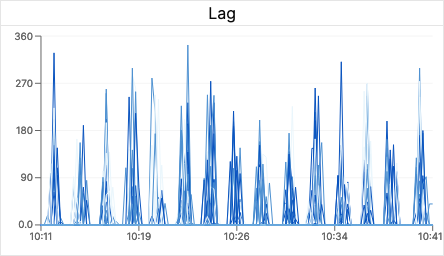
| Lag (Table) | kafka_streams_records_lag | This is a table of per topic-partition lag (the number of events behind the latest record) |
| Title | Metric (Exposed via Metrics API) | Description |
|---|---|---|
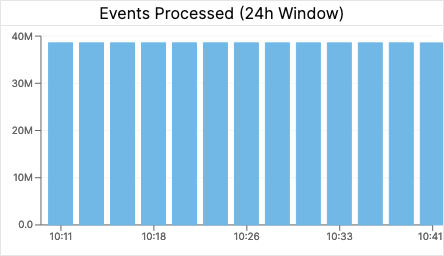
| Events Processed | Derivative of responsive_kafka_streams_source_offset_end summed by topic | The total number of events processed by this application per day (used for billing) |
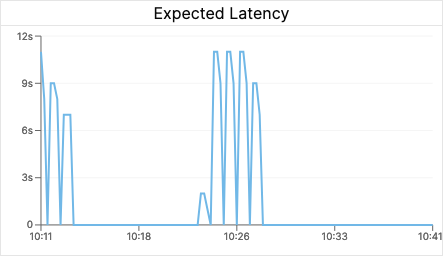
| Expected Latency | diagnoser_latency_expected_node_seconds | The expected amount of time it would take for an event to be processed if it were enqueued onto the source topic now. |
| Title | Metric (Exposed via Metrics API) | Description |
|---|---|---|
| Lag (Graph) | kafka_streams_records_lag | This is a graph of per topic-partition lag (the number of events behind the latest record) |
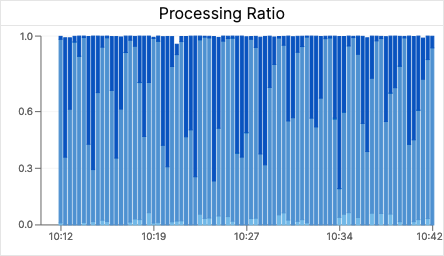
| Processing Ratio | kafka_streams_thread_{commit,poll,punctuate,process}_ratio | The percentage of time spent in each of the main phases of computation (commit, poll, punctuate, process) |
| Title | Metric (Exposed via Metrics API) | Description |
|---|---|---|
| Rebalancing | kafka_streams_rebalance_rate | This will be a value of 1 if during a period of time there was a rebalance, otherwise it will be 0 |
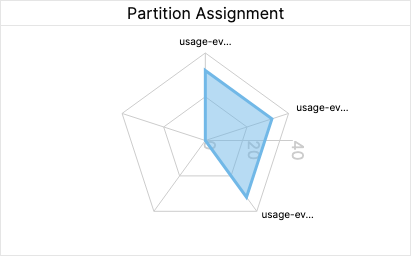
| Partition Assignment | kafka_streams_assigned_partitions | This is the number of partitions assigned to each instance of your application. |
Storage Metrics
| Title | MongoDB Metric / ScyllaDB Metric | Description |
|---|---|---|
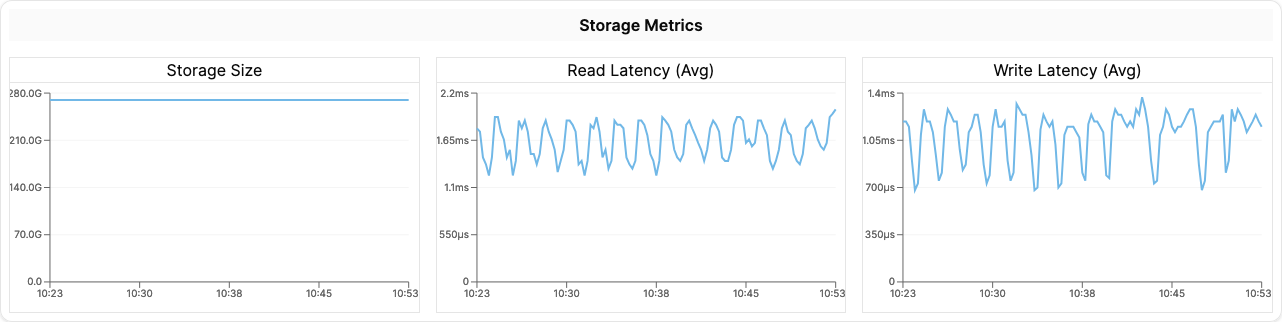
| Storage Size | hardware_disk_metrics_disk_space_used_byte node_filesystem_size_bytes | The amount of remote storage utilized (across all applications using this storage) |
| Read Latency (Avg) | mongodb_opLatencies_reads_latency rlatencya | The average read latency |
| Write Latency (Avg) | mongodb_opLatencies_writes_latency wlatencya | The average write latency |
Metrics API
The metrics API for your organization is available at <org id>-<env id>.metrics.us-west-2.aws.responsive.cloud and
authenticates using the API keys you create for that environment in the UI. This means that if you are using
prometheus you can configure a prometheus scrape job to scrape these metrics:
job_name: responsive-streams-metrics
scrape_interval: 10s
scheme: https
metrics_path: /export
basic_auth:
  username: <api key> # this is an API key created in your Responsive Cloud environment
  password: <secret>  # this is the secret for the key created above
static_configs:
  - targets:
    - <org id>-<env id>.metrics.us-west-2.aws.responsive.cloud
Once you’ve got an application reporting metrics to Responsive and your API keys, you can simply run local docker
Prometheus and Grafana containers to pull data from Responsive. First make sure that you have prometheus.yml in
your local directory setup correctly (with the scrape job config from above).
Then run the following docker commands:
docker run --name prometheus -d -p 9090:9090 \
  -v $(pwd)/prometheus.yml:/etc/prometheus/prometheus.yml \
  prom/prometheus

docker run -d -p 3000:3000 --name=grafana grafana/grafana-enterprise
Once that is up and running, you can setup grafana to use your local prometheus instance (use http://host.docker.internal:9090 as the URL for prometheus if you haven’t set up explicit docker networking).
Recreate the Responsive Dashboard
Import the dashboard definition below and you’ll immediately start seeing the metrics show up in Grafana!
Responsive Grafana Dashboard