Autoscaling
This documentation starts with a bit of history around how to manually tune Kafka Streams clusters. This is important to understand how we came up with our autoscaling algorithms and which metrics we collect.
If you are only curious about how the autoscaling works, jump down to the autoscaling section.
History & Manual Scaling
Before Responsive, sizing Kafka Streams clusters was an iterative process.
You start off by guessing a good starting configuration and waiting for it to stabilize. If you see certain metric anomalies (we'll get into these in a bit), you can tune or resize your cluster hardware. When this process is over, you rely on your monitoring to indicate whether the current cluster configuration is healthy:
This worst part of this process is that you have to repeat it for every application you deploy. Characteristics of your deployment such as the processor topology, the serialization format, the business requirements and seasonality all factor in to the equation.
Stabilize
A good recommendation (that applies to ResponsiveKafkaStreams clusters as well) is
to start with a relatively small cluster and size up as necessary:
| Amount | Resource | Notes |
|---|---|---|
| 2 | Cores | |
| 4-8 | GB RAM per Core | |
| 256GB | SSD | (Not required for Responsive) |
| 1 | Nodes | 2x for RocksDB |
With this cluster deployed, the next step is to ensure that your application is healthy. We define healthy using the following checklist:
| Task | Notes | |
|---|---|---|
| Ensure progress is being made | Ensure committed offsets are progressing. This is preferable to checking lag or processing rate since the former can grow while you are still processing and the latter can mislead if you are reprocessing the same events. | |
| Ensure no rebalances | The metric to check here is last-rebalance-seconds-ago which is reported by mbean:kafka.consumer:type=consumer-coordinator-metrics,client-id={clientId} | |
Make sure all clients are RUNNING | This metric (state reported by mbean:kafka.streams:type=streams-metrics,client-id={clientId}) is a little tougher to collect since it emits as a number, but the value 2 is equivalent to RUNNING. | |
| Make sure you bound memory usage | If you are using RocksDB, you need to bound memory utilization. See this developer guide for more details. |
Size & Tune
Before we talk about how to resize a Kafka Streams cluster, you need to determine if you should resize your cluster at all.
If you've already read our Autoscaling Policy Reference you may notice that the table below closely correlates to the different types of scaling policies. This is no coincidence!
| Indicator | MBean | Operation | Notes |
|---|---|---|---|
| Process Rate | kafka.streams:type=stream-thread-metrics,name=process-rate | UP or DOWN | The simplest (but perhaps least useful) proxy for sizing your cluster is how many events per second each node is processing. If you have relatively stable traffic, you can size up when this number gets near your threshold. |
| Lag | kafka.consumer:type=consumer-fetch-manager-metrics,name=records-lag | UP | Lag isn't necessarily a problem so long as it isn't increasing. Checking the derivative of lag to make sure you're making progress is the key metric. |
| Expected Latency | N/A | UP | Responsive computes a metric based on the process rate and the input append late that computes the amount of time we expect it to take to process the event that was just enqueued. This metric will often correlate with your business SLAs, and is a great indicator of health. |
| Thread Saturation | kafka.consumer:type=consumer-metrics,name=blocked-time-ns-total | DOWN | The most reliable indicator of whether it is safe to scale down is whether or not your threads are blocked. At some high ratio (e.g. 60% or more), you can safely scale down. |
The first three indicators can help you figure out if there's a problem, but they won't help you figure out whether scaling up will solve your problem. The last indicator (Thread Saturation) will help you figure out if it's a resource utilization problem. If thread saturation is low, but Lag and/or Expected Latency keep going up it's time to check whether there's a problem with your Kafka Brokers or network.
Autoscaling
Now that we covered how to approach manually sizing a Kafka Streams workload, you are already familiar with the mechanics and criteria that Responsive uses to automatically address chaning workload demands.
To safely autoscale, you must configure your state stores to use Responsive remote storage. Scaling up and down with embedded RocksDB state will trigger rebalances with extended periods of restoration and downtime!
You define a policy that specifies health goals for the application based on one of the indicators in the table above. The Responsive Controller then combines the policy with metrics and status updates sent from the application and Responsive Controller to decide how to keep your cluster healthy. Finally, it coordinates with the application and Responsive Operator to automatically execute remediating actions.
Architecture
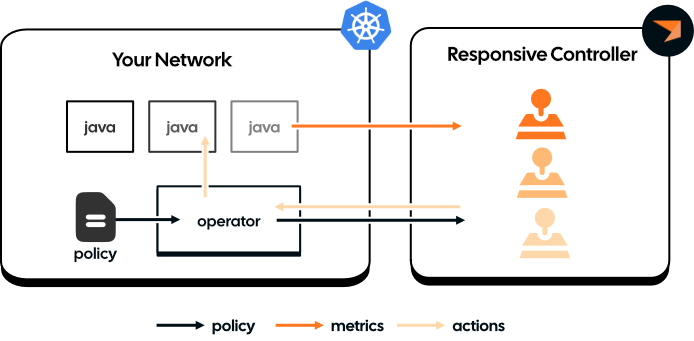
There are a few components to the autoscaling architecture:
- A Policy Spec: this is a kubernetes custom resource which specifies a declarative language for defining your goals as well as constraints on meeting those goals.
- The Responsive Operator: this is a kubernetes operator that can execute actions in your network, such as scaling, on behalf of the Responsive Controller.
- The Responsive Controller: the controller runs in Responsive Cloud and is responsible for making sure that your applications are meeting the health goals specified in your policy.
The interactions between these components are outlined in the diagram above. You first define your policy and register it with your Kuberentes cluster. The operator monitors the installed policies and the applications they point to, and updates the Responsive Controller with the current policy spec and status of the applications (such as the number of nodes currently deployed and whether those nodes are healthy).
All the smarts happen in the Controller. It processes metrics sent by the application (such as
the current processing rates, the topic end offsets and the consumer lag). The controller
combines these metrics with the policy spec and application status sent by Operator to decide
whether the application meets the health goals defined in the policy. If it doesn't, or will
soon likely violate those goals it coordinates with the Operator and/or the application to
execute some remediating action, like changing the number of replicas in your application's
Deployment or StatefulSet, or changing the task assignment.
Note that the Controller has additional safeguards and best practices built into it. For example, there is a "cooldown" period on policy evaluation so that it won't trigger back-to-back scaling events in situations with unpredictable short-term traffic.
Next Steps
- To learn how to get started with autoscaling, follow our Quickstart.
- To see all available policies and learn how to specify them, see our Technical Reference.